← Back to Service Overview

Strategic Data Analytics Examples

Practical examples of how Sapient helps teams turn ERP exports, pricing files, vendor metrics, demand signals, and operational records into statistically grounded insight that supports pricing, forecasting, vendor performance, and operational decision-making.

Statistical analysis organizes the signals. People focus on the decision.

Strategic analytics image examples

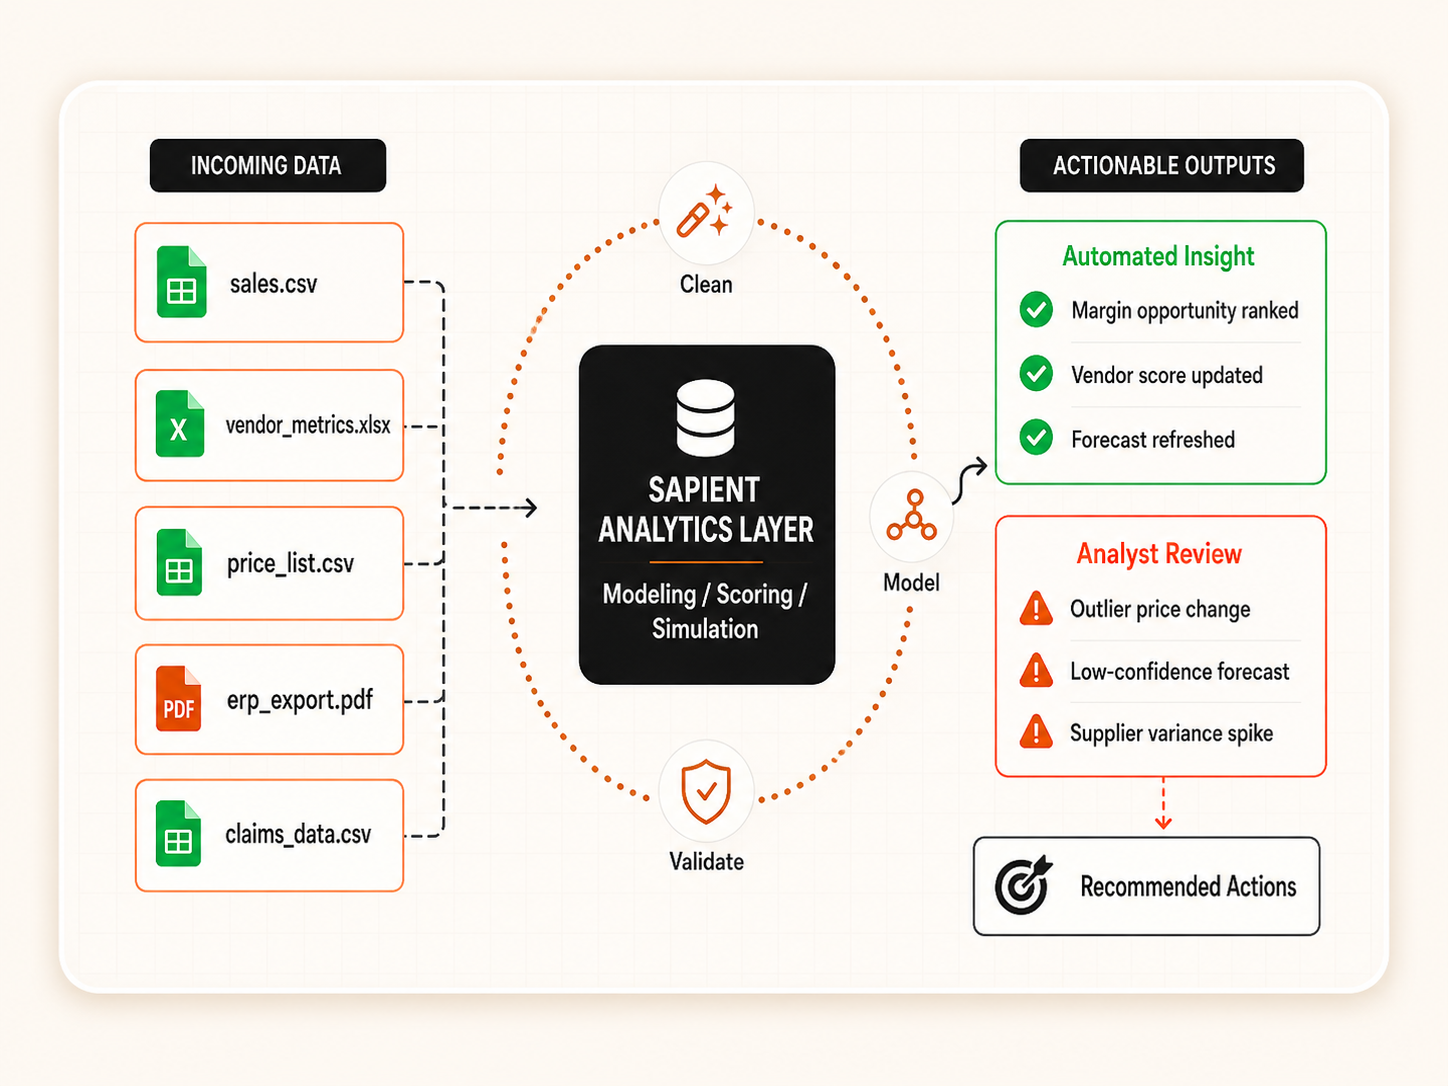
Strategic analytics concept overview showing scattered files turned into cleaned data, modeled insight, and recommended actions

Concept Overview

Turn scattered files into modeled insight before teams make decisions.

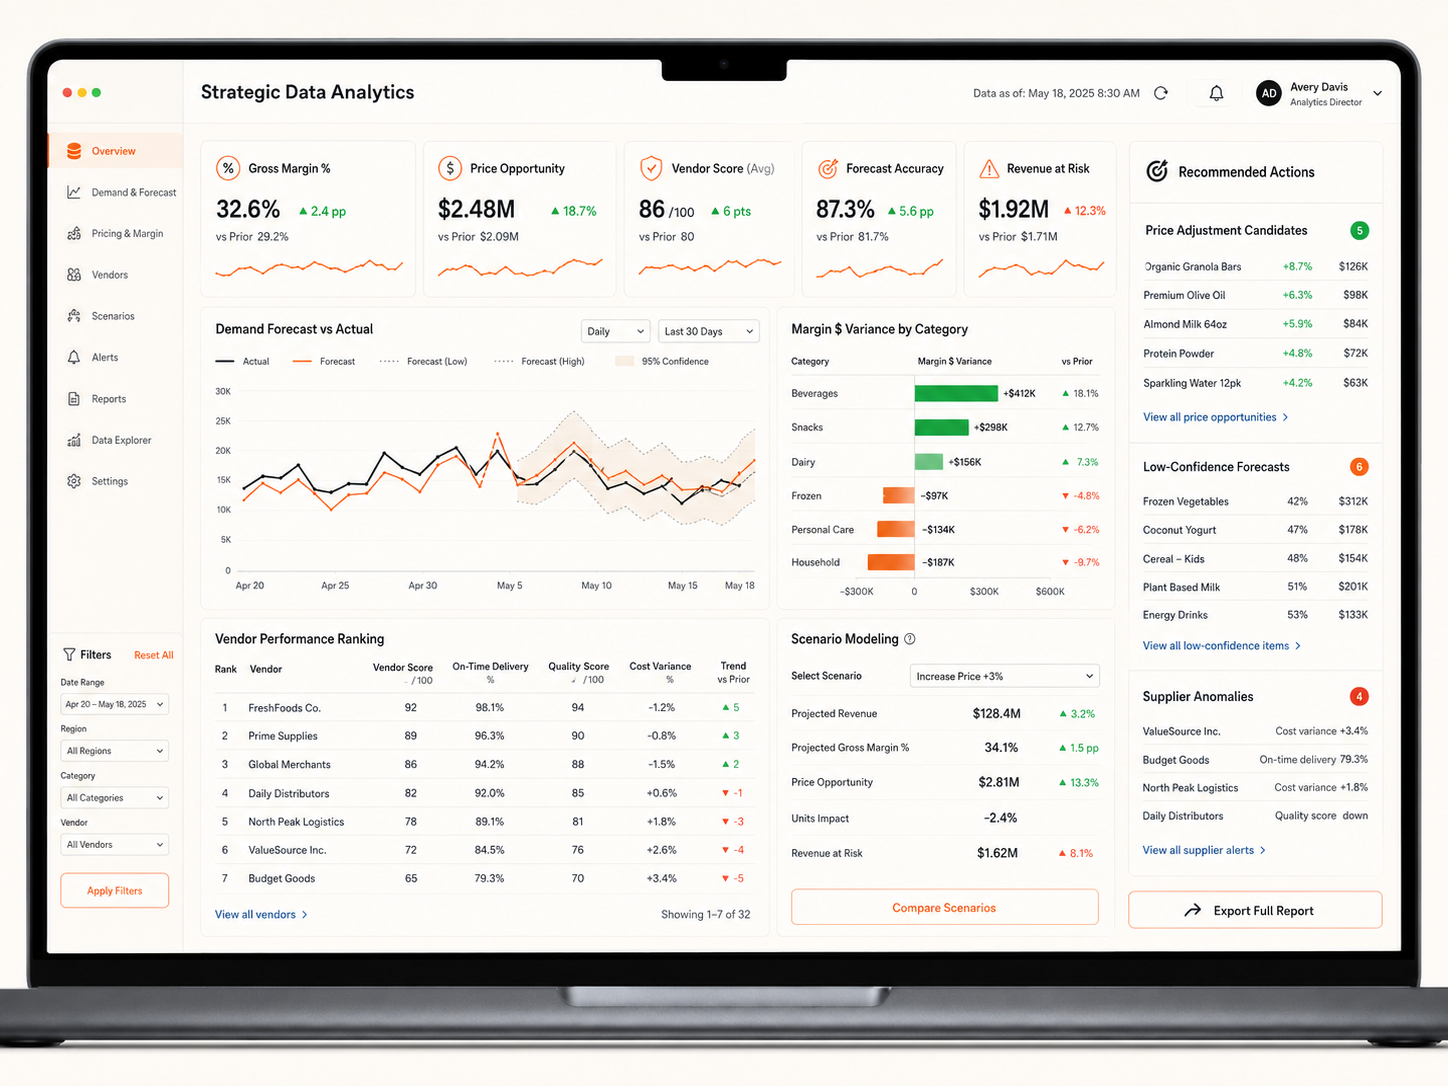
Strategic analytics laptop dashboard showing pricing, vendor, forecast, and risk signals

Dashboard View

See pricing, vendor, forecasting, and risk signals in one decision view.
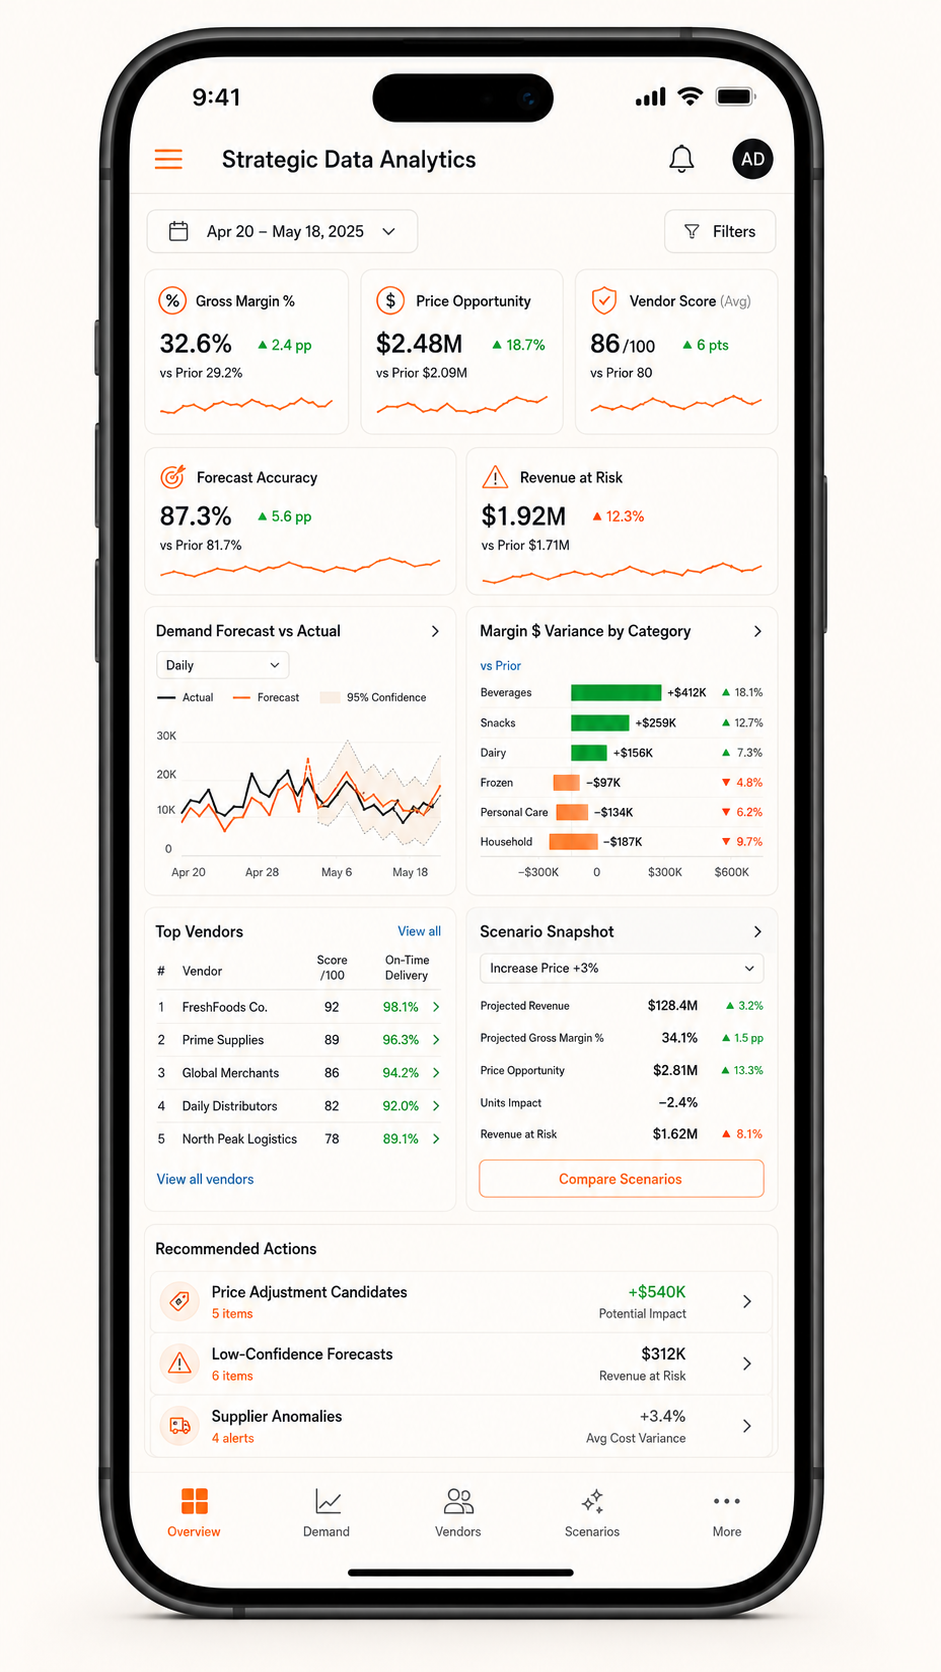
Strategic analytics mobile view showing KPIs, trends, and recommended actions

Mobile View

Give leaders a compact view of KPIs, trends, and recommended actions.

Strategic data analytics Examples

Pricing and Margin Analysis

Challenge
Unclear margin drivers, inconsistent pricing logic, and scattered cost inputs can make it difficult to know where pricing is helping or hurting profitability.
Sapient Solution
Analyze price, cost, discounting, sales history, product mix, and customer or payer patterns to identify margin drivers and pricing opportunities.
Business Value
Supports higher margins, smarter pricing decisions, and reduced underpricing.

Vendor Performance Scoring

Challenge
Vendor comparisons are often spread across delivery records, cost changes, quality issues, service notes, and subjective feedback.
Sapient Solution
Build composite vendor scorecards using delivery, cost, quality, service, reliability, and compliance metrics.
Business Value
Improves vendor accountability, purchasing decisions, and data-driven sourcing.

Demand Forecasting and Scenario Modeling

Challenge
Forecasts may be inaccurate, difficult to explain, or disconnected from operational planning.
Sapient Solution
Use historical demand, seasonality, product mix, and operational patterns to build forecasts and scenario models that estimate future impact.
Business Value
Improves planning, reduces stockouts or overstocking, and helps teams prepare for expected demand changes.

Operational Decision Support

Challenge
Teams may have plenty of data but limited clarity on which action to take next.
Sapient Solution
Model operational trade-offs, quantify expected impact, and summarize recommended actions in dashboards, reports, or alerts.
Business Value
Helps leaders make faster decisions with measurable impact on cost, service, and productivity.

Exception and Anomaly Detection

Challenge
Unusual trends, outliers, and data problems are often found late after they already affected performance.
Sapient Solution
Apply rules, thresholds, statistical checks, and anomaly detection to surface unusual activity in key metrics.
Business Value
Enables earlier issue detection, risk reduction, and proactive review.

Revenue Leakage and Variance Monitoring

Challenge
Revenue leaks, unexplained variances, and financial drift can go unnoticed when teams rely on manual reviews.
Sapient Solution
Track actuals versus expected values, compare drivers by source, and flag variance patterns that need review.
Business Value
Helps protect revenue, improve forecast accuracy, and increase financial accountability.

Example Workflow

Pricing and Margin Analysis

Challenge

A company has sales, costs, pricing, discounts, and vendor data spread across multiple exports, spreadsheets, and systems. Standard reports show totals, but they do not clearly explain which products, vendors, customers, or pricing decisions are driving margin changes.

Business Value

A strategic analytics workflow helps leaders identify pricing opportunities, margin risks, vendor performance issues, and forecast changes earlier. Instead of reviewing every spreadsheet manually, managers can focus on the decisions most likely to improve profit, service, and planning accuracy.

  1. Collect Inputs

    Bring together sales, pricing, cost, discount, vendor, product, customer, and operational data from available systems and exports.

  2. Clean and Normalize

    Standardize fields, resolve missing values, align product/vendor/customer names, and prepare the data for reliable analysis.

  3. Model and Score

    Calculate margin drivers, vendor scores, forecast accuracy, scenario impacts, and outlier patterns.

  4. Simulate Scenarios

    Test pricing changes, volume shifts, cost changes, vendor changes, or forecast assumptions to estimate business impact.

  5. Deliver Insight

    Publish dashboards, reports, alerts, exports, or recommended actions so teams can review and act on the results.

This pattern can be adapted to pricing reviews, vendor scorecards, purchasing analysis, demand planning, revenue monitoring, operational dashboards, and other business decisions that require more than basic reporting.

Common signals we can work from

Strategic analytics does not always require a new system. Useful signals often already exist across exports, spreadsheets, reports, databases, and operational workflows.

  • ERP exports
  • Sales transaction files
  • Pricing and discount spreadsheets
  • Product and item master data
  • Vendor scorecards and quality metrics
  • Purchase history and cost records
  • Demand history and forecasts
  • Margin and cost reports
  • Inventory, service, or operational data
  • Customer, payer, or account records
  • External benchmarks or market data
  • Budget and planning assumptions

What the output can show

  • Margin opportunities
  • Pricing risk and underpricing
  • Vendor rankings and scorecards
  • Forecast accuracy
  • Scenario comparisons
  • Revenue leakage indicators
  • Cost variance drivers
  • Demand patterns
  • Outliers needing review
  • Recommended actions
  • Dashboard views
  • Alerts and notifications

Sample Stack Used - Representative tools and architecture we may use when analysis requires modeling, automation, and operational delivery - not just spreadsheet reporting.


Software / Platforms

  • Python (pandas, statsmodels, scikit-learn)
  • Power BI / Tableau
  • dbt, BigQuery, Snowflake
  • Jupyter / notebook workflows

Architecture

  • Data ingestion and transformation pipelines
  • Statistical models and scenario simulation
  • Recommendation and exception logic
  • Scheduled reporting and alert delivery

Languages / Interfaces

  • SQL
  • Python
  • DAX / Power Query
  • APIs / CSV / Excel integration

Start With The Signal

Need deeper analysis before making the decision?

Sapient can help review your current data, calculations, reports, and decisions to identify where analytics could create practical operational value.

Start a Conversation