← Back to Service Overview

Visualize Workflow & Operations Examples

See how work moves, where it slows down, and what needs attention through process views, dashboards, and operational summaries.

Automation organizes the signals. People focus on what needs attention.

Workflow and operations image examples

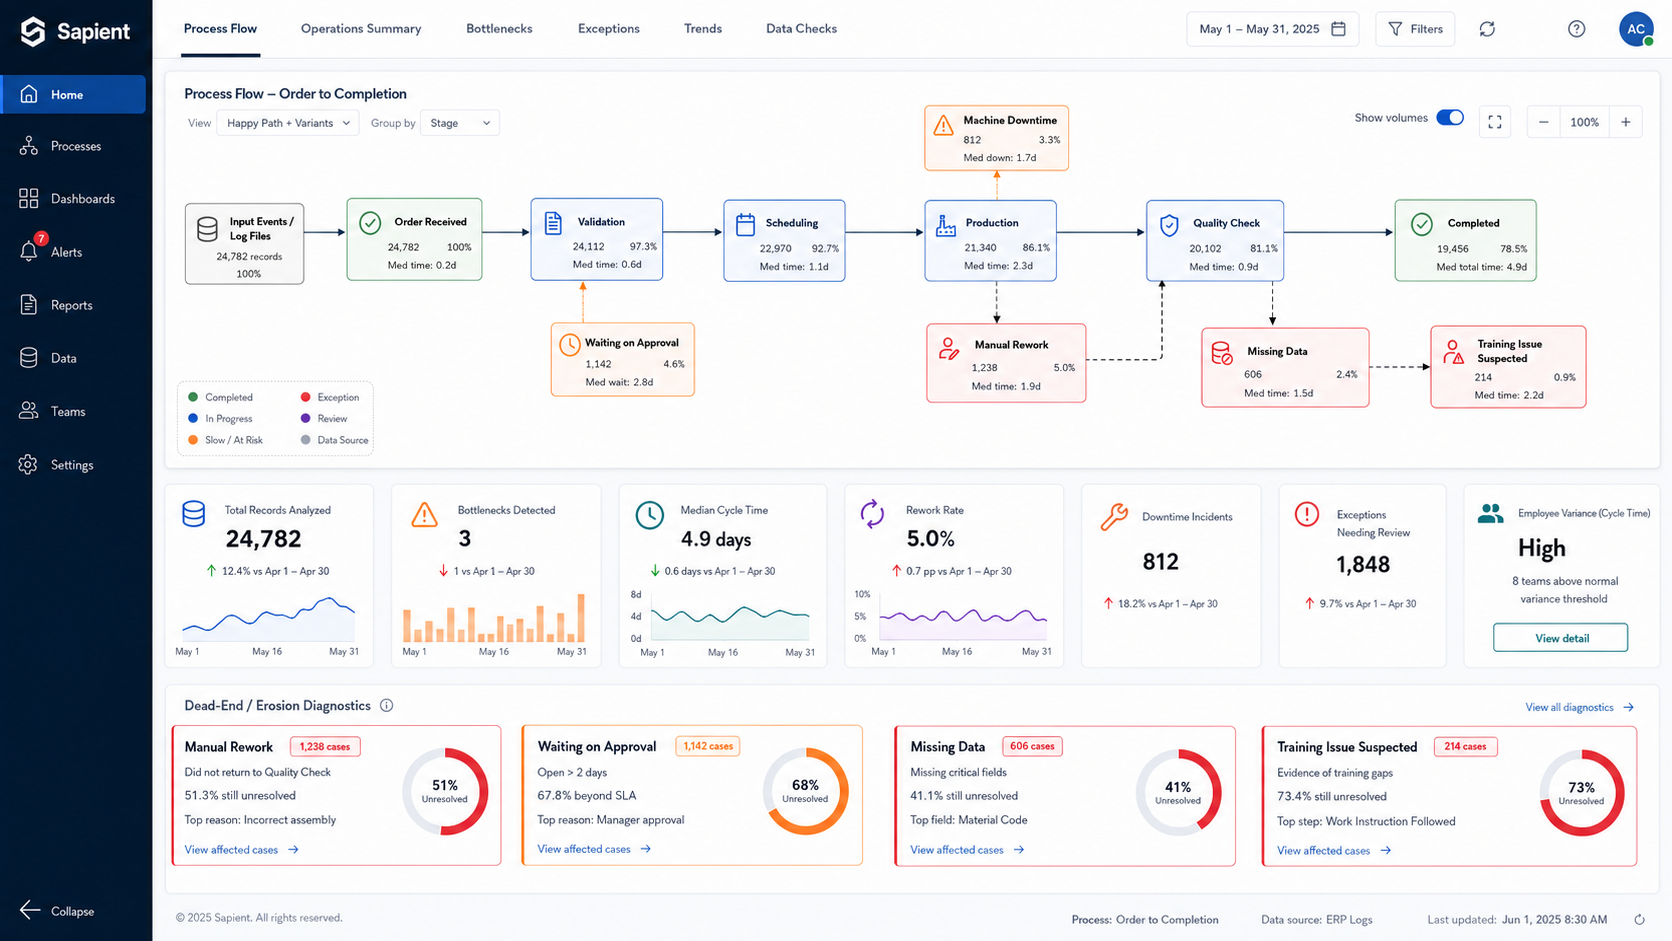
Workflow visualization dashboard showing bottlenecks, exceptions, rework, and cycle-time delays

Workflow View

Spot bottlenecks, wait points, rework loops, and cycle-time delays across the full workflow.

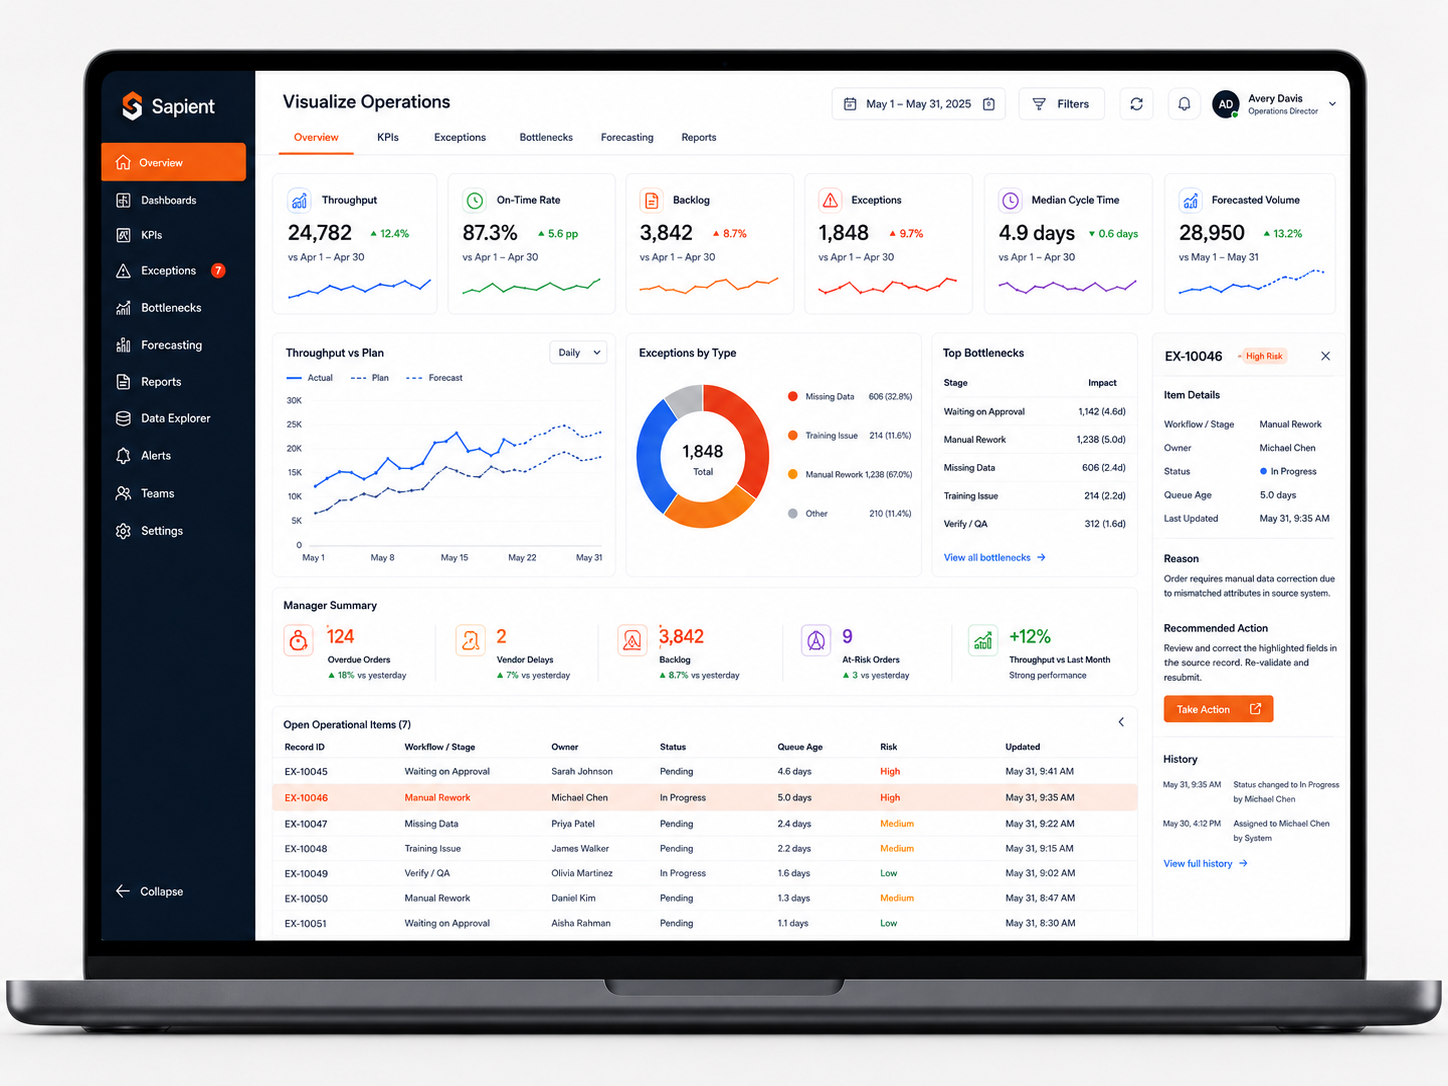
Operations dashboard showing KPIs, exception tables, bottlenecks, forecasts, and drill-down details

Operations View

Give managers dashboards, exception views, drill-downs, and summaries that show what needs attention.

Visualize Workflow and Operations Examples

Process Bottleneck Detection

Challenge
Teams know work is slowing down, but the exact step, queue, or handoff causing the delay is not always visible from standard reports.
Sapient Solution
Use timestamps, system events, work orders, and status changes to build a process view that shows where cases wait, repeat, or stall.
Business Value
Helps managers focus improvement efforts on the actual constraint instead of relying on assumptions or manual investigation.

Median Time Between Steps

Challenge
Reports may show total cycle time, but not how long work sits between intake, review, scheduling, production, approval, or completion.
Sapient Solution
Calculate median time between process steps and highlight the handoffs or queues where work spends the most time.
Business Value
Makes delay patterns easier to see and gives teams a practical baseline for improving flow.

Rework and Repeat-Delay Tracking

Challenge
Rework loops and repeat delays are often hidden inside notes, status changes, reopened work items, or repeated handoffs.
Sapient Solution
Track when work moves backward, repeats a prior step, reopens after completion, or cycles through the same queue multiple times.
Business Value
Helps reduce avoidable rework and gives leaders a clearer view of process erosion.

KPI and Exception Dashboards

Challenge
Teams rely on manual spreadsheets, disconnected reports, or inbox updates to understand performance and identify urgent issues.
Sapient Solution
Bring key metrics, overdue items, missing data, blocked work, and high-risk exceptions into focused dashboard views.
Business Value
Gives leaders faster visibility and helps teams respond before issues create downstream delays.

Manager Summary Views

Challenge
Managers often receive too much raw detail and not enough clear summary insight to support daily decisions.
Sapient Solution
Create manager-ready views that summarize performance, risks, workload, exceptions, and trends in one place.
Business Value
Improves decision-making and makes status review more efficient and consistent.

Cross-System Operational Control Tower

Challenge
Critical operational data lives across multiple systems, making it hard to see the full picture in one view.
Sapient Solution
Combine data from ERP, CRM, service, warehouse, spreadsheets, and other systems into a centralized operating view.
Business Value
Creates a clearer operating picture and gives leadership one place to monitor performance, workflow constraints, and issues.

Example Workflow

Workflow & Operations Visibility

Challenge

Operational leaders often need to understand where work is slowing down, what needs attention, and which issues are affecting performance, but the signals are scattered across systems, exports, logs, dashboards, and team handoffs.

Business Value

A combined workflow and operations visibility solution gives teams one place to see process flow, bottlenecks, KPIs, exceptions, and manager-ready summaries so they can act earlier and improve the work with more confidence.

  1. Collect Signals

    Bring together system logs, event timestamps, work orders, status history, ERP or CRM exports, spreadsheets, machine events, and operational records.

  2. Normalize & Model

    Standardize fields, align business definitions, and structure events, metrics, owners, queues, and outcomes into reliable reporting data.

  3. Map Workflow & Metrics

    Build process views, KPI definitions, drill-downs, cycle-time measures, backlog indicators, and operational summaries.

  4. Surface Bottlenecks & Exceptions

    Highlight wait points, rework loops, missing data, overdue items, capacity risk, and cross-system issues that need attention.

  5. Review, Act & Improve

    Give managers and teams clear views they can use to prioritize work, investigate issues, and monitor whether changes improve performance.

This pattern can be adapted to service workflows, production processes, order handling, approvals, healthcare operations, field service, finance operations, back-office teams, and other multi-step operational work.

Common signals we can work from

Workflow and operational visibility do not always require a new system. Useful signals often already exist across exports, logs, timestamps, dashboards, and operational records.

  • System log files
  • Work orders and tickets
  • Status history
  • Timestamped exports
  • Interim scans or barcode events
  • ERP, CRM, MES, or service-system exports
  • Machine or equipment logs
  • Employee or team activity records
  • QA or inspection notes
  • Spreadsheet exports
  • Email or handoff records

What the output can show

  • Process map with common and alternate paths
  • Median time between steps
  • Longest wait points
  • Rework loops
  • KPI dashboards
  • Exception views
  • Backlog and aging trends
  • Forecasting or capacity signals
  • Team or queue-level variation
  • Cross-system operating summary
  • Manager-ready improvement summary

Sample Stack Used - Representative tools and architecture we may use when workflow visibility, process analysis, dashboards, or operational reporting requires more than lightweight automation.


Software / Platforms

  • Power BI, Tableau, or Looker
  • Grafana or Metabase
  • dbt and data warehouses
  • ERP, CRM, MES, or service-system exports
  • Process mining or workflow analytics tools

Architecture

  • Event-log and timestamp modeling
  • KPI definitions and semantic layers
  • Process-map, cycle-time, and bottleneck analysis
  • Cross-system data modeling and drill-down reporting
  • Scheduled or near real-time operational refresh

Languages / Interfaces

  • SQL
  • Python
  • DAX
  • Power Query or M
  • CSV, API, or database connectors

Start With Better Visibility

Not sure where work is slowing down or what needs attention?

Sapient can help review your current systems, exports, logs, dashboards, and handoffs to identify where workflow and operational visibility could create practical value.

Start a Conversation